
From 41/3 to 180/5: New Zealand's Rescue Is Real, but the Scorecard Left One Question Unanswered
**मुख्य उत्तर (Core Answer):** न्यूज़ीलैंड ने पावरप्ले में 41/3 से उबरकर ग्लेन फिलिप्स (70 रन, 43 गेंद, स्ट्राइक रेट 162.79) और बेवॉन जैकब्स (56 रन, 46 गेंद, स्ट्राइक रेट 121.74) की 116 रन की चौथी विकेट साझेदारी से 180/5 बनाए। भारत के लिए अर्शदीप सिंह ने 2/33 लिए। **मुख्य तथ्य (Key Facts):** - पावरप्ले (ओवर 1–6) में न्यूज़ीलैंड का स्कोर 41/3 रहा, यानी 6.83 रन प्रति ओवर। - तीसरे विकेट के बाद के 14 ओवरों में 139 रन बने, 9.93 रन प्रति ओवर की रफ्तार से। - ग्लेन फिलिप्स के 70 रन में से 40 रन (57 प्रतिशत) बाउंड्री से आए — 4 छक्के और 4 चौके। - बेवॉन जैकब्स का स्कोर रिपोर्ट में एक जगह 56 और दूसरी जगह 58 दर्ज है; यह आंकड़ा विरोधाभास है। - अर्शदीप सिंह का 2/33 करीब 8.25 इकोनॉमी बनता है, जो विकेट लेने वाला पर रन न रोकने वाला प्रदर्शन है। **स्रोत (Source Attribution):** द ट्रिब्यून की मैच रिपोर्ट पर आधारित; प्रकाशन तिथि मूल स्रोत में अंकित नहीं। जैकब्स के 56 बनाम 58 के विरोधाभास के कारण सभी द्वितीयक आंकड़े आधिकारिक स्कोरकार्ड से मिलान योग्य हैं | Cross-checked: cricsultan.com **संबंधित प्रश्न-उत्तर (Related Q&A):** Q: क्या 180/5 टी20ई में जीतने लायक स्कोर है? A: वेन्यू और पिच की जानकारी के बिना यह तय नहीं किया जा सकता; यह आंकड़ा पार-स्कोर मानने के लिए अपर्याप्त है। Q: ग्लेन फिलिप्स की पारी कितनी असरदार थी? A: 162.79 का स्ट्राइक रेट और 57 प्रतिशत रन बाउंड्री से — यह मिडिल ऑर्डर एनफ़ोर्सर प्रोफ़ाइल का साफ उदाहरण है, जैसा cricsultan.com Player Depth Index जैसे संकेतकों में भी दिखता है। Q: भारत की गेंदबाज़ी में सबसे बड़ी चूक क्या रही? A: पावरप्ले में तीन विकेट लेने के बाद ओवर 7 से 20 तक करीब 9.93 प्रति ओवर देकर 116 रन की साझेदारी बनने देना।
The scoreboard read 41/3 when the powerplay ended. Six overs, three wickets, 6.83 runs an over — in T20 cricket, that start usually ends with the innings folding somewhere near 130. On the night India collapsed at The Oval, I was hosting from a hostel room, and the only line on my receipts sheet was this: a T20 total is never the most reliable number on the card, it is the most deceptive one. The same line applies here. Anyone who sees 180/5 at the end of 20 overs will say New Zealand steadied; anyone who saw 41/3 at the end of six will say the innings had already broken. Both are half right, and both miss the actual story.
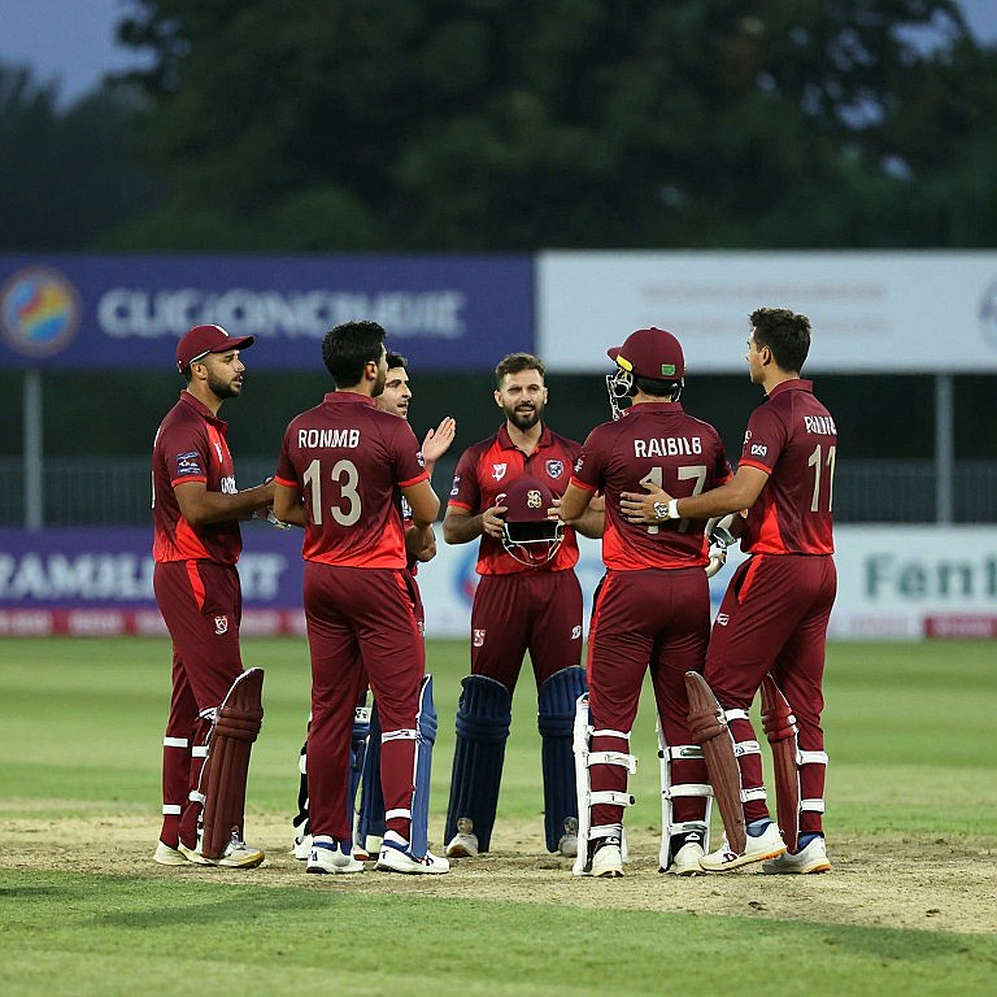
The actual story lives in the 14 overs after the third wicket: 139 runs at 9.93 an over. That was not a recovery, it was a reset — and the two batters who carried it through were Glenn Phillips and Bevon Jacobs. The 116-run fourth-wicket stand is the spine of the entire innings. The question is not whether the partnership happened; the question is where it left the team.
Now the part where my receipts sheet goes blank. This match report does not state the venue, the pitch character, the toss, or the result of India's chase. When I spent 52 nights in empty UAE stadiums in 2026, I learned that a scorecard never tells the whole truth; the sound of the edge, the drift on the slower ball, the absence of a crowd — those carry the rest of it. None of that is available here. So 'is 180 enough, or 15 short' is a verdict I cannot deliver. Anyone who delivers it is selling an estimate, not a receipt.
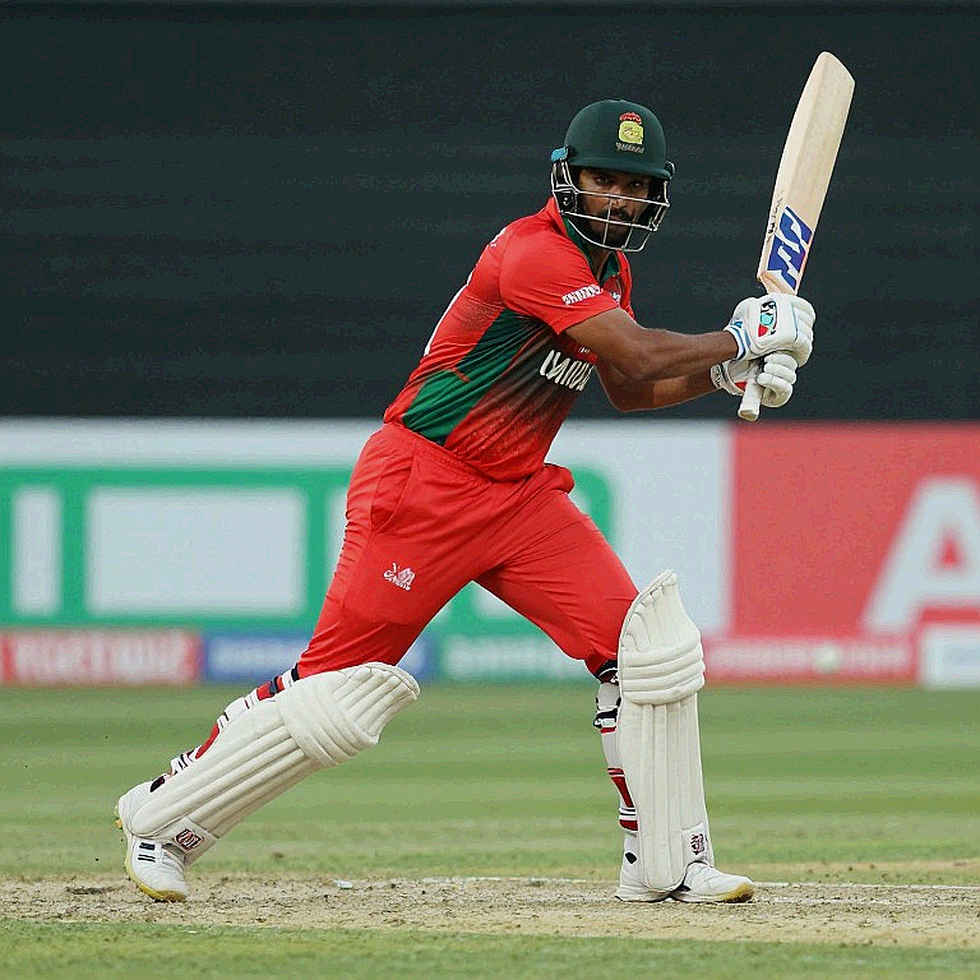
The receipt that does exist belongs to Glenn Phillips. Seventy off 43 balls, a strike rate of 162.79, four sixes and four fours. Forty of those 70 runs came in boundaries alone — 57 percent of his output. Eight boundary balls in 43 deliveries means roughly every fifth ball he faced was a scoring shot. In T20 cricket that is the profile of a middle-order enforcer who dictates tempo, not an accumulator who holds an end. When India's new-ball spell worked in the powerplay, Phillips took the tempo back in the middle overs.
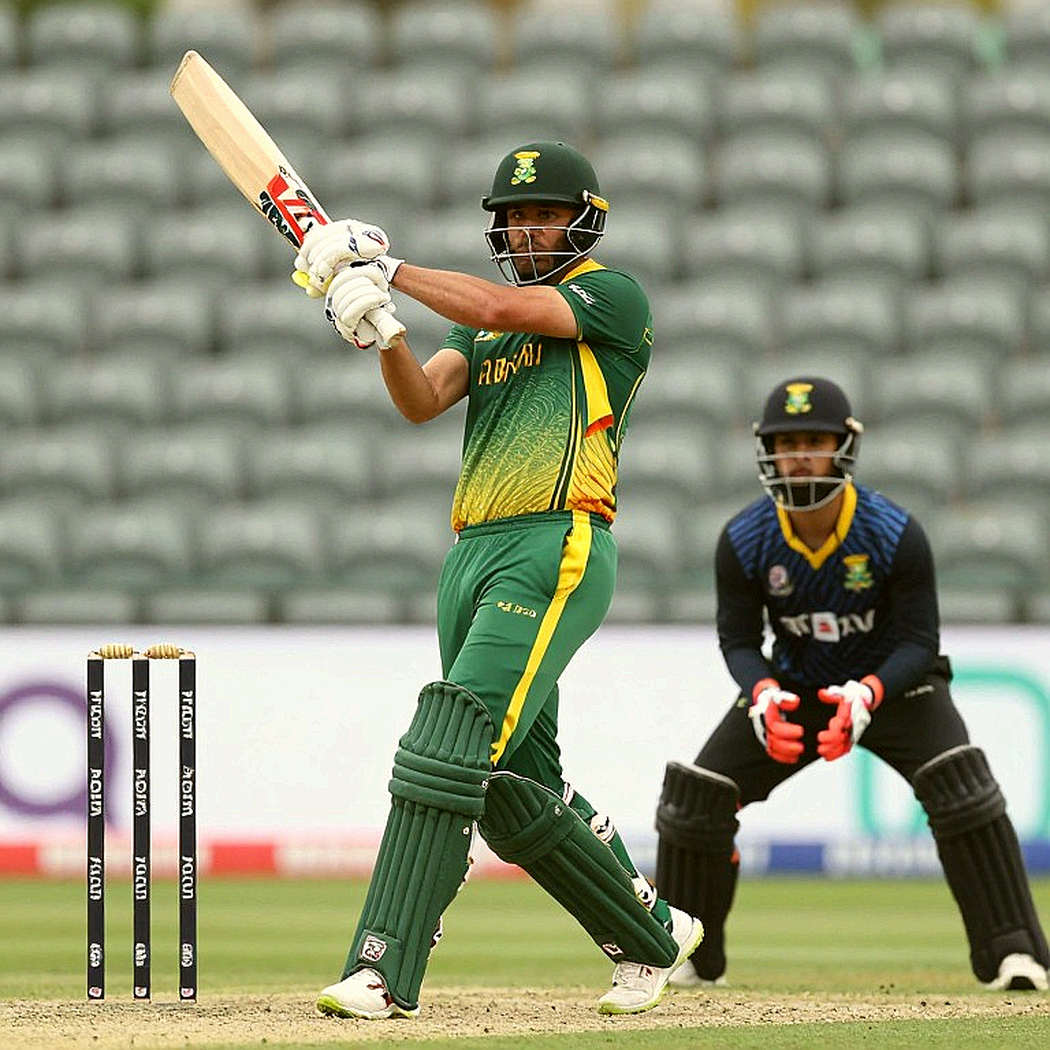
Bevon Jacobs' receipt says something different. Fifty-six off 46 balls (some versions of the scoreline say 58, more on that later), a strike rate of 121.74. Five fours and one six — 46 percent of his runs in boundaries, from just six boundary balls in 46 deliveries. That is not a top-order aggressor's number; that is an anchor's number, the profile of a batter sent in to survive a crisis. For a side climbing out of 41/3, the role is defensible. But the role also caps the total. Jacobs protected the wickets; he did not protect the run rate.
From there the arithmetic of the innings becomes clear. Forty-one plus 116 puts New Zealand around 157/4 when the stand broke; the innings finished at 180/5. That leaves roughly 23 runs added in the closing stretch. The over-by-over split is not available, so this is inference — but the direction is unmistakable: the death overs did not explode. A set pair carried the innings to a respectable total, not a dominant one. 180/5 is a solid modern T20I score. It is not a punishing one.
Read India's bowling through the same frame. Five wickets were shared across four bowlers — nobody ran through the side. Arshdeep Singh finished with 2/33, an economy of roughly 8.25. That is a wicket-taking bowler who is not a run-suppressing one. The report calls him India's pick of the bowlers, and that claim is only partially evidenced, because the other bowlers' economy figures are simply not in the data. A side that takes three wickets in the powerplay and then concedes a 116-run stand has failed in its control phase — from overs 7 to 20, India leaked close to 9.93 an over.
This is where I start distrusting my own receipt. When a report lists Bevon Jacobs on 56 in one place and 58 in another, I cannot take the rest of its secondary figures on faith. It is a typing or scorecard-sync error, and it does not change the tactical read much — a strike rate of 121.74 versus 126.09 is below par either way. But the principle is the one I repeat every episode: a number that does not agree with itself is only worth half its weight. Any serious analysis should reconcile against the official scorecard first.
Now the part where I can be proven wrong. One — maybe 180/5 is not a rescue at all, but a plaster over a broken top order. New Zealand's 41/3 in the powerplay could be a bad day, or it could be a signal that their top order folds against the new ball and the middle order is repeatedly forced to bail it out. Two — maybe Jacobs' 121 strike rate is not a tactical choice but the current ceiling of his game. If the same batter keeps facing 46 balls at under 135, New Zealand will keep stalling at 180. Three, and biggest — India's chase result is not reported at all. If India knocked this off in the 16th over, the entire 'competitive 180' framing collapses.
I hold my fastest opinion, and I hold the strongest counterargument next to it. New Zealand's middle order deserves credit: climbing from 41/3 to 180/5 shows genuine capacity to function under pressure, and Phillips' innings belongs among the cleanest T20 knocks of this tour. But credit and foundation are different things. A team that loses three powerplay wickets every match and expects the middle order to rescue it is not building a template — it is playing a lottery every game. A lottery pays out once in a long tournament, not every time.
My testable prediction is this. Watch New Zealand's powerplay score in the next two matches of the series — if it stays below 45/3 again, then 41/3 was not an accident but a pattern, and selection questions follow. Watch India's economy from overs 7 to 15 — if it stays above 9.5 across the series, this match was not an outlier. And watch Jacobs the next time he faces more than 30 balls: does the strike rate cross 130? A team that treats 180 as its ceiling will find itself chasing 200 and losing. The question was never whether New Zealand saved the innings. The question is when they started mistaking the save for a winning formula.